flamegraph
brew install flamegraph
v1.0_1
CDDL-1.0
Stack trace visualizer
17
30-day installs · #7245
66
90-day · #6591
389
365-day · #5671
19.6k
★ GitHub stars · updated 2y ago
Links
- https://github.com/brendangregg/FlameGraph
- GitHub: brendangregg/FlameGraph
- Brew formula source: Formula/f/flamegraph.rb
Raw metadata
{
"aliases": [],
"alternatives": [],
"build_dependencies": [],
"categories": [],
"caveats": null,
"conflicts_with": [],
"dependencies": [],
"deprecated": 0,
"deprecation_reason": null,
"desc": "Stack trace visualizer",
"disable_reason": null,
"disabled": 0,
"enrichment_fetched_at": "2026-06-20T23:37:41+00:00",
"first_seen": "2026-06-20T23:34:18+00:00",
"full_name": "flamegraph",
"github_default_branch": "master",
"github_last_commit_at": "2024-10-20T21:48:45Z",
"github_readme_excerpt": "# Flame Graphs visualize profiled code\n\nMain Website: http://www.brendangregg.com/flamegraphs.html\n\nExample (click to zoom):\n\n[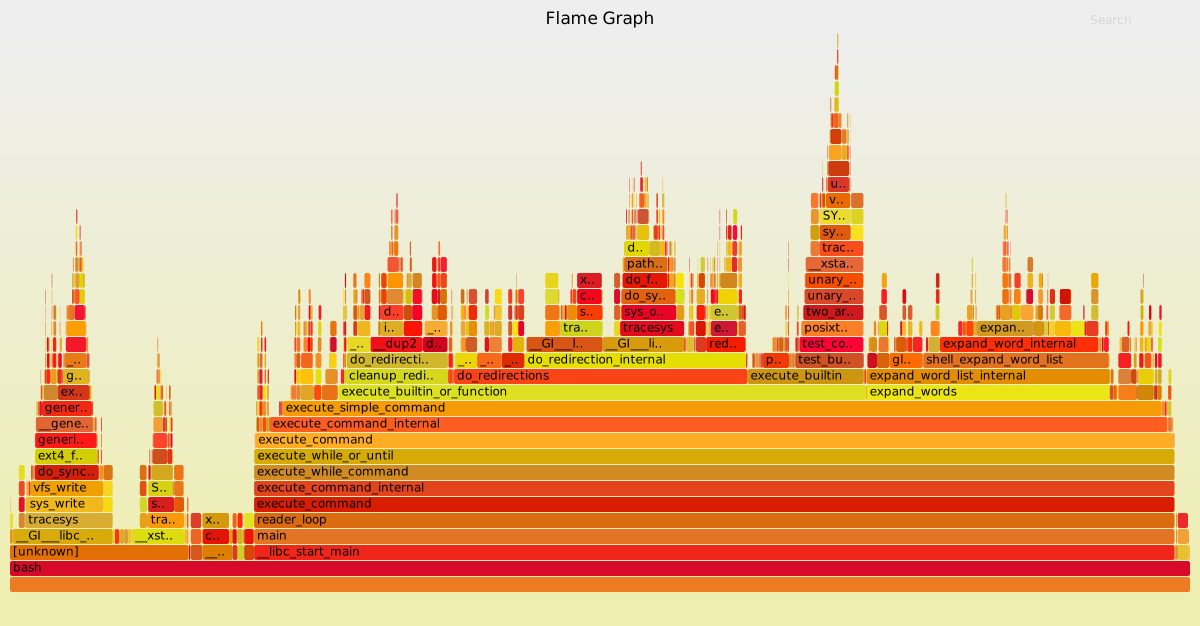](http://www.brendangregg.com/FlameGraphs/cpu-bash-flamegraph.svg)\n\nClick a box to zoom the Flame Graph to this stack frame only.\nTo search and highlight all stack frames matching a regular expression, click the _search_ button in the upper right corner or press Ctrl-F.\nBy default, search is case sensitive, but this can be toggled by pressing Ctrl-I or by clicking the _ic_ button in the upper right corner.\n\nOther sites:\n- The Flame Graph article in ACMQ and CACM: http://queue.acm.org/detail.cfm?id=2927301 http://cacm.acm.org/magazines/2016/6/202665-the-flame-graph/abstract\n- CPU profiling using Linux perf\\_events, DTrace, SystemTap, or ktap: http://www.brendangregg.com/FlameGraphs/cpuflamegraphs.html\n- CPU profiling using XCode Instruments: http://schani.wordpress.com/2012/11/16/flame-graphs-for-instruments/ \n- CPU profiling using Xperf.exe: http://randomascii.wordpress.com/2013/03/26/summarizing-xperf-cpu-usage-with-flame-graphs/ \n- Memory profiling: http://www.brendangregg.com/FlameGraphs/memoryflamegraphs.html \n- Other examples, updates, and news: http://www.brendangregg.com/flamegraphs.html#Updates\n\nFlame graphs can be created in three steps:\n\n1. Capture stacks\n2. Fold stacks\n3. flamegraph.pl\n\n1\\. Capture stacks\n=================\nStack samples can be captured using Linux perf\\_events, FreeBSD pmcstat (hwpmc), DTrace, SystemTap, and many other profilers. See the stackcollapse-\\* converters.\n\n### Linux perf\\_events\n\nUsing Linux perf\\_events (aka \"perf\") to capture 60 seconds of 99 Hertz stack samples, both user- and kernel-level stacks, all processes:\n\n```\n# perf record -F 99 -a -g -- sleep 60\n# perf script \u003e out.perf\n```\n\nNow only capturing PID 181:\n\n```\n# perf record -F 99 -p 181 -g -- sleep 60\n# perf script \u003e out.perf\n```\n\n### DTrace\n\nUsing DTrace to capture 6",
"github_repo": "brendangregg/FlameGraph",
"github_stars": 19558,
"github_topics": [],
"homepage": "https://github.com/brendangregg/FlameGraph",
"homepage_og_description": null,
"homepage_og_image": null,
"homepage_title": null,
"installs_30d": 17,
"installs_365d": 389,
"installs_90d": 66,
"keg_only": 0,
"keg_only_reason": null,
"last_seen": "2026-06-20T23:34:18+00:00",
"license": "CDDL-1.0",
"llm_generated_at": null,
"llm_model": null,
"name": "flamegraph",
"oldnames": [],
"one_liner": null,
"optional_dependencies": [],
"rank_30d": 7245,
"rank_365d": 5671,
"rank_90d": 6591,
"raw_hash": "f8648f4a0ff12c8f",
"recommended_dependencies": [],
"revision": 1,
"ruby_source_path": "Formula/f/flamegraph.rb",
"tap": "homebrew/core",
"test_dependencies": [],
"uses_from_macos": [
"perl"
],
"version_head": "HEAD",
"version_stable": "1.0",
"versioned_formulae": [],
"why_use_this": null
}